
 Fountain ownership extends beyond the initial purchase, requiring careful water feature expense planning for long-term success. Annual maintenance includes electricity, water treatments, supplies, and occasional professional services that preserve both function and value. Understanding these ongoing obligations allows homeowners to make informed decisions about fountain selection, care strategies, and budget allocation. A clear strategic plan for ongoing pond and fountain maintenance keeps your water feature a source of enjoyment rather than financial stress.
Key Takeaways
- Annual fountain costs typically range from $200 to $600 for residential installations
- Material selection directly impacts lifespan, with metal fountains exceeding 20 years
- Orange County’s mild climate allows year-round fountain operation without extensive winterization
- Well-maintained fountains retain 60-80% of their value over five years
- Professional maintenance services complement DIY care to optimize longevity and performance
What Are the Main Types of Fountains and Their Features?
Fountains vary significantly in design, scale, and application across residential and commercial settings. Each category offers distinct aesthetic qualities, maintenance requirements, and installation considerations that influence both upfront investment and ongoing care. Understanding these differences helps homeowners select fountains that align with their space constraints, visual preferences, and maintenance capabilities.
How Do Tiered, Wall, Rock/Zen, and Architectural Fountains Differ?
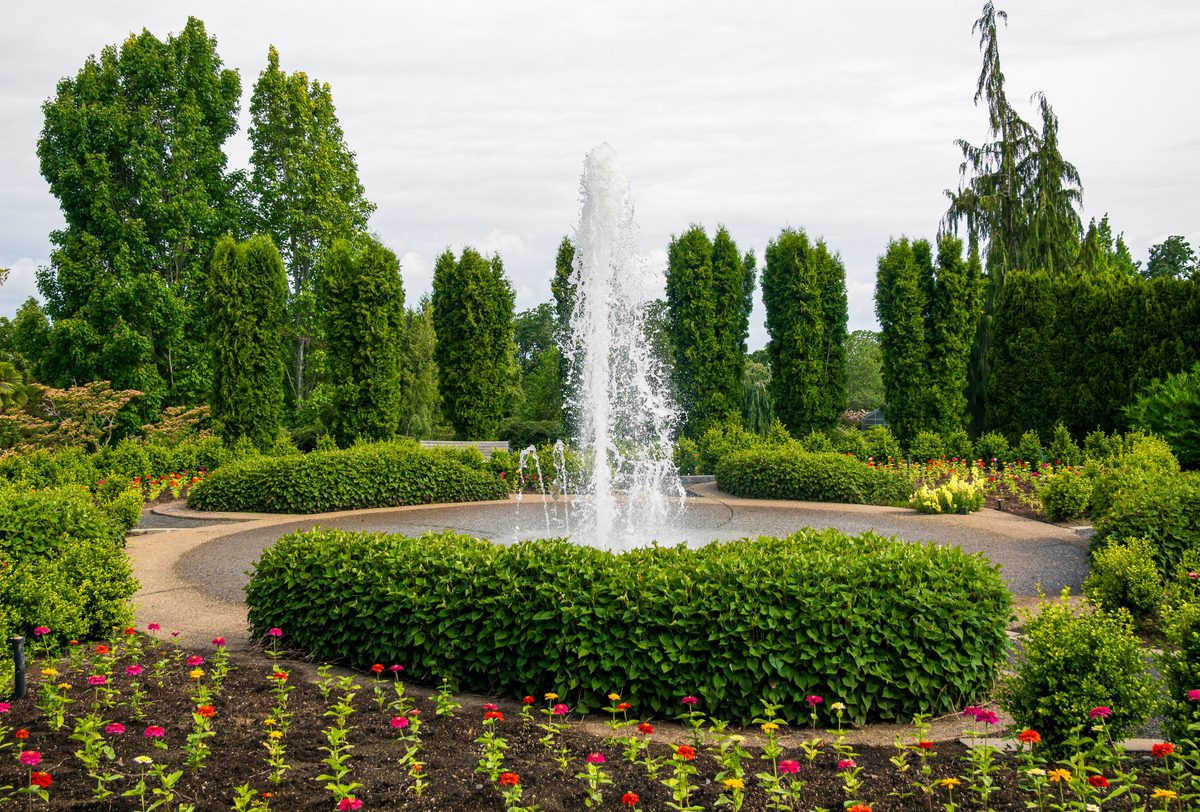
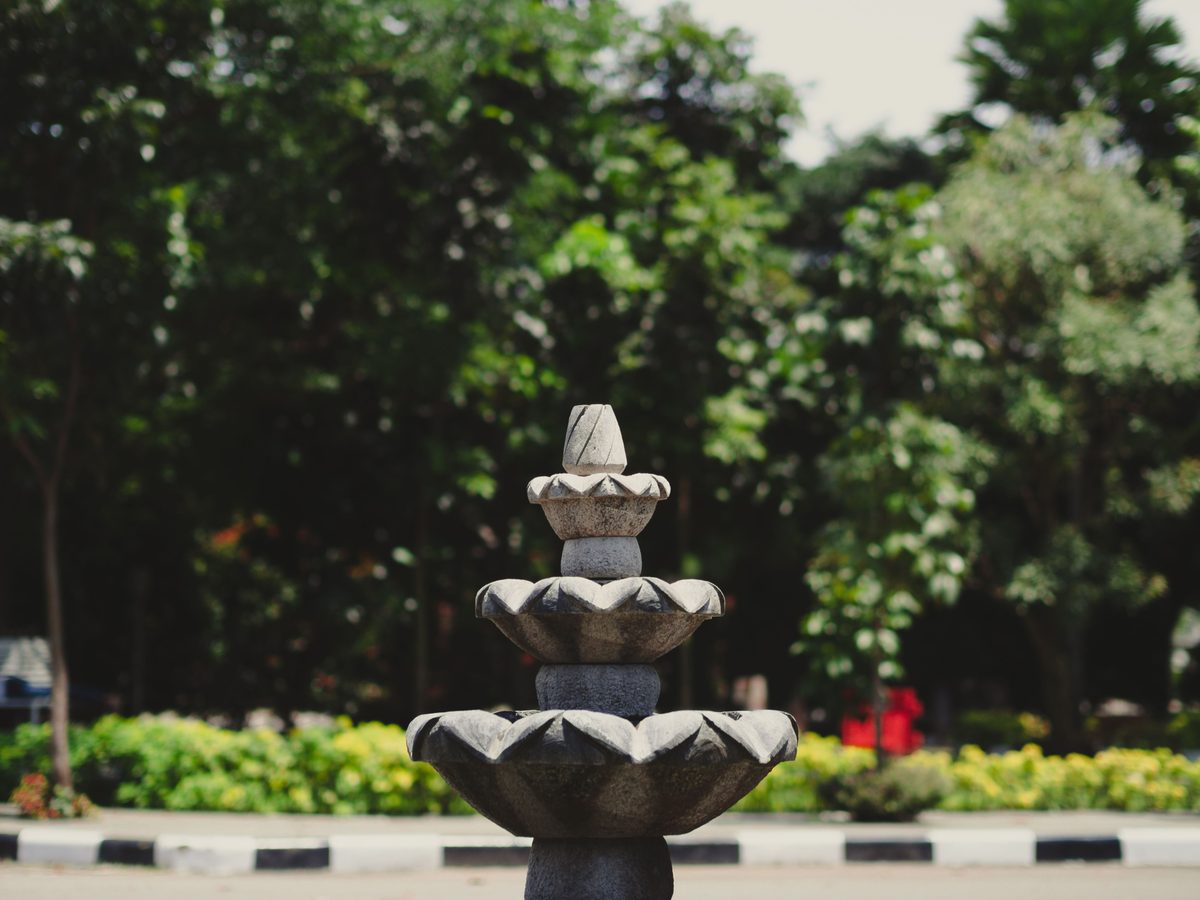
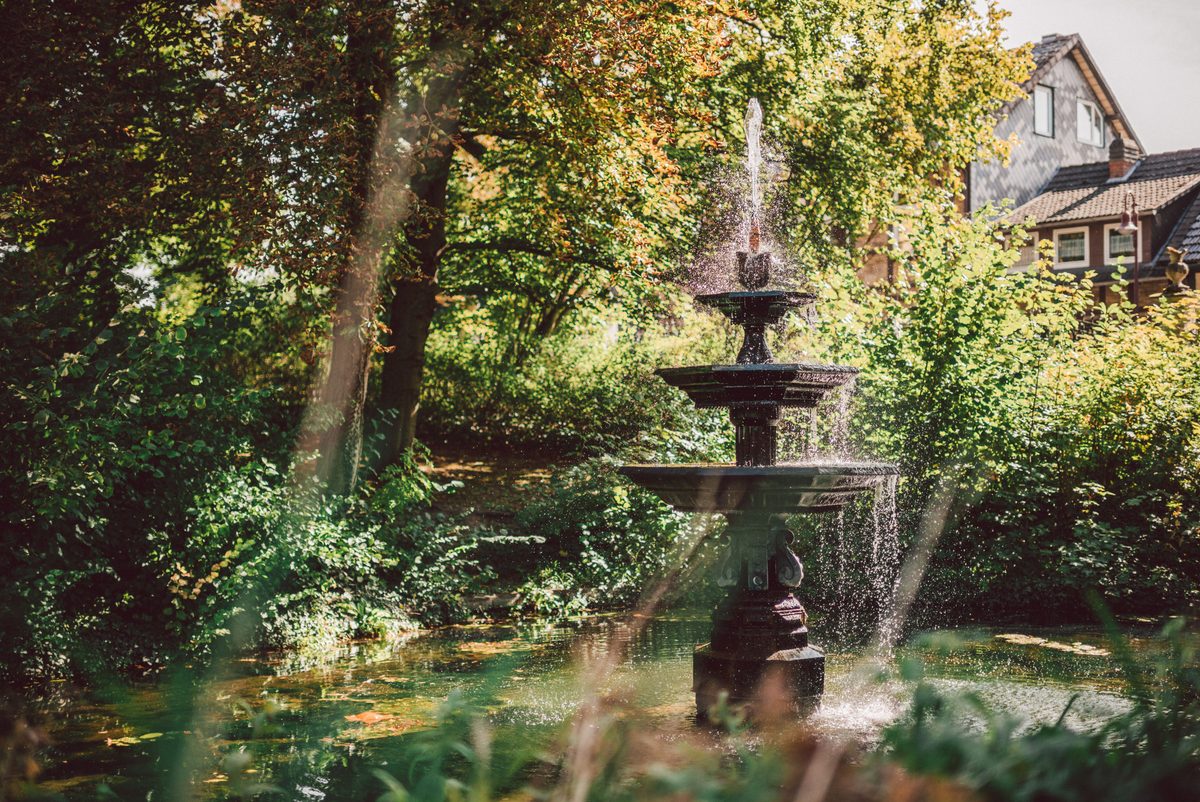
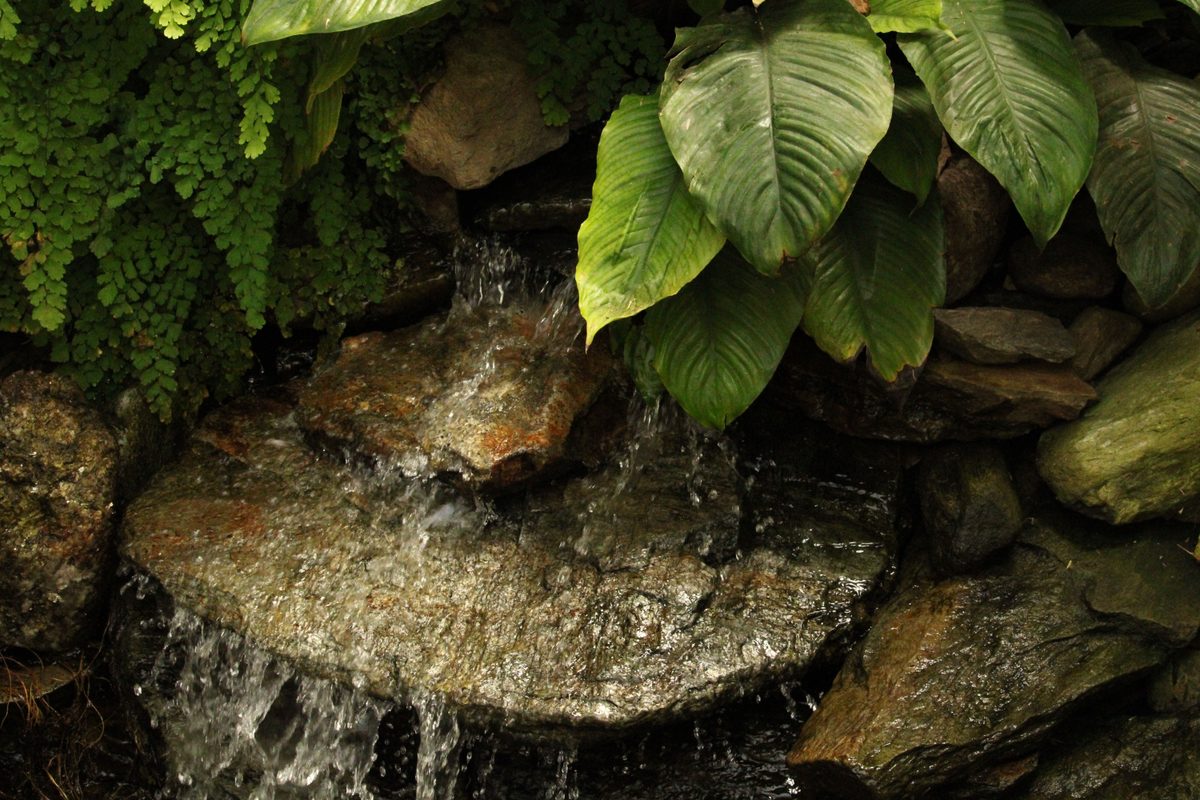
Tiered fountains feature multiple basins arranged vertically, creating classic elegance through cascading water flow. Wall fountains mount vertically to save floor space while delivering architectural integration and visual interest. Rock and zen fountains emphasize naturalistic design using organic materials and asymmetrical water patterns. Architectural fountains represent custom-designed, large-scale installations that often incorporate integrated lighting and sophisticated water effects.
What Materials Affect Fountain Durability and Lifespan?
Material choice determines fountain longevity more than any other single factor. Modern metal fountains constructed from stainless steel or copper often exceed 20-year lifespans due to corrosion resistance. Concrete fountains last 10-20 years when properly sealed against moisture penetration and freeze damage. Resin and composite materials typically last 3-7 years before showing significant degradation from UV exposure.
How Does Fountain Type Influence Initial Cost?
Prefabricated tiered fountains range from $100 to $3,000, depending on size and material quality. Wall fountains typically cost $150 to $500, making them affordable options for space-limited installations. Rock and zen fountains cost between $200 and $1,500 for standard residential models. Architectural fountains command premium pricing from $3,000 to over $70,000 based on customization complexity. Most residential fountains cost $1,100 to $7,500 at initial purchase.
Why Is Understanding Fountain Ownership Costs Essential?
Fountain ownership represents a long-term financial commitment requiring annual fountain costs beyond the purchase price. Electricity, water treatments, maintenance supplies, and eventual pump replacement create recurring expenses that accumulate significantly over time. Understanding these obligations enables realistic budgeting and prevents unexpected financial strain from necessary upkeep.
What Constitutes the True Cost of Fountain Ownership?
Well-maintained fountains retain 60-80% of their value over five years when properly cared for. Installing a high-quality outdoor water fountain can enhance property value by 3-8%, depending on installation type. These retention and appreciation rates offset long-term maintenance expenses, making fountains financially sustainable investments. Proper care protects both the fountain’s function and the homeowner’s financial stake in the installation.
How Do Electricity and Water Treatment Impact Annual Expenses?
Fountain pumps typically draw power comparable to a household light bulb, minimizing electricity consumption. Annual electricity costs range from $50 to $150 based on pump size and daily operation hours. Water treatments, including algaecides, clarifiers, and scale removers, cost $100 to $200 annually and form the core of routine water quality protection for residential fountains. Energy-efficient types of fountains significantly reduce these operational expenses through optimized pump technology.
When Should You Budget for Pump Replacement and Repairs?
Pump replacement becomes necessary every 3-7 years, depending on usage intensity and water quality. The pump drives the entire water system, so timely replacement protects the connected filtration and plumbing components. Replacement pumps cost $200 to $500 for standard residential fountains, representing a significant periodic expense. Maintenance supplies, including brushes, filters, and minor repair components, add $50 to $100 annually. Fountain repair costs vary based on damage severity and component availability in local markets.
How Do Consumer Preferences Shape Fountain Maintenance Needs?
Consumer choices directly influence maintenance complexity, frequency, and cost across different fountain types. Urban and suburban settings create distinct space constraints that favor specific fountain categories and care approaches. Age demographics further segment preferences between DIY maintenance and professional service reliance, affecting annual budgets and care strategies.
What Are Urban Vs. Suburban Fountain Ownership Patterns?
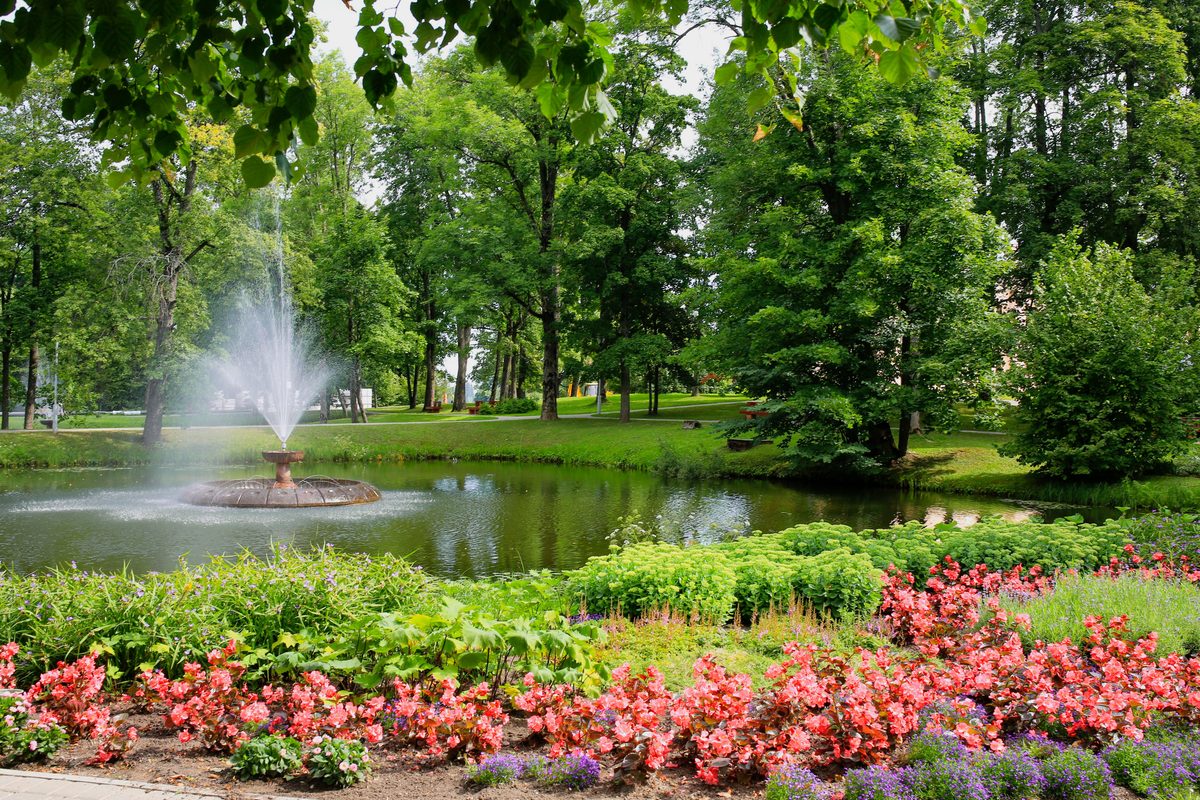
Urban settings represent 25% of the population with strong preferences for compact, low-maintenance options. Suburban settings constitute 43% of the population and favor larger installations, including rock fountains and tiered designs. Urban consumers prioritize wall fountains and small tiered models due to space limitations and installation constraints. Suburban homeowners integrate fountains into broader landscape architecture, selecting freestanding designs that complement extensive outdoor areas, sometimes alongside garden ponds or retention ponds on larger lots.
How Do Age Demographics Affect Maintenance Choices?
Younger homeowners under 44 prioritize DIY maintenance skills and energy-efficient fountain designs. Older demographics lean toward professional maintenance services and classic architectural styles requiring specialized care. This generational divide influences both initial fountain selection and ongoing maintenance strategy decisions. Professional pond maintenance benefits appeal strongly to time-strapped older homeowners seeking hassle-free water feature enjoyment.
Which Fountain Types Are Preferred by Different Consumer Segments?
Architectural fountains lead the market share at 42.5% across commercial and high-end residential installations. Tiered fountains hold 25% market share, appealing to traditional aesthetic preferences and residential applications. Wall fountains capture 15% market share among space-conscious urban buyers and architectural integrations. Rock and zen fountains represent 12% market share, attracting buyers seeking naturalistic landscape integration.
Can Climate Influence Year-Round Fountain Maintenance?
Climate conditions determine whether fountains require seasonal winterization or support continuous year-round operation. Orange County’s Mediterranean climate, with average winter lows of 47-54°F, eliminates most freeze risks. The region experiences nearly 300 sunny days per year, creating distinct maintenance priorities around algae control. Understanding local climate patterns allows homeowners to optimize care strategies and avoid unnecessary seasonal shutdown procedures.
What Are the Benefits and Risks of Leaving a Fountain Uncovered in Mild Climates?
Orange County’s mild winters rarely produce sustained freezing temperatures that damage fountain components. The primary danger to fountains remains water expansion during freezing, which cracks basins and destroys pumps. Because hard freezes occur infrequently in temperate coastal regions, rigorous winterization becomes unnecessary for most installations. Seasonal fountain care tips address climate-specific maintenance priorities without requiring a complete seasonal shutdown.
How Should Algae, Evaporation, and Mineral Deposits Be Managed Year-Round?
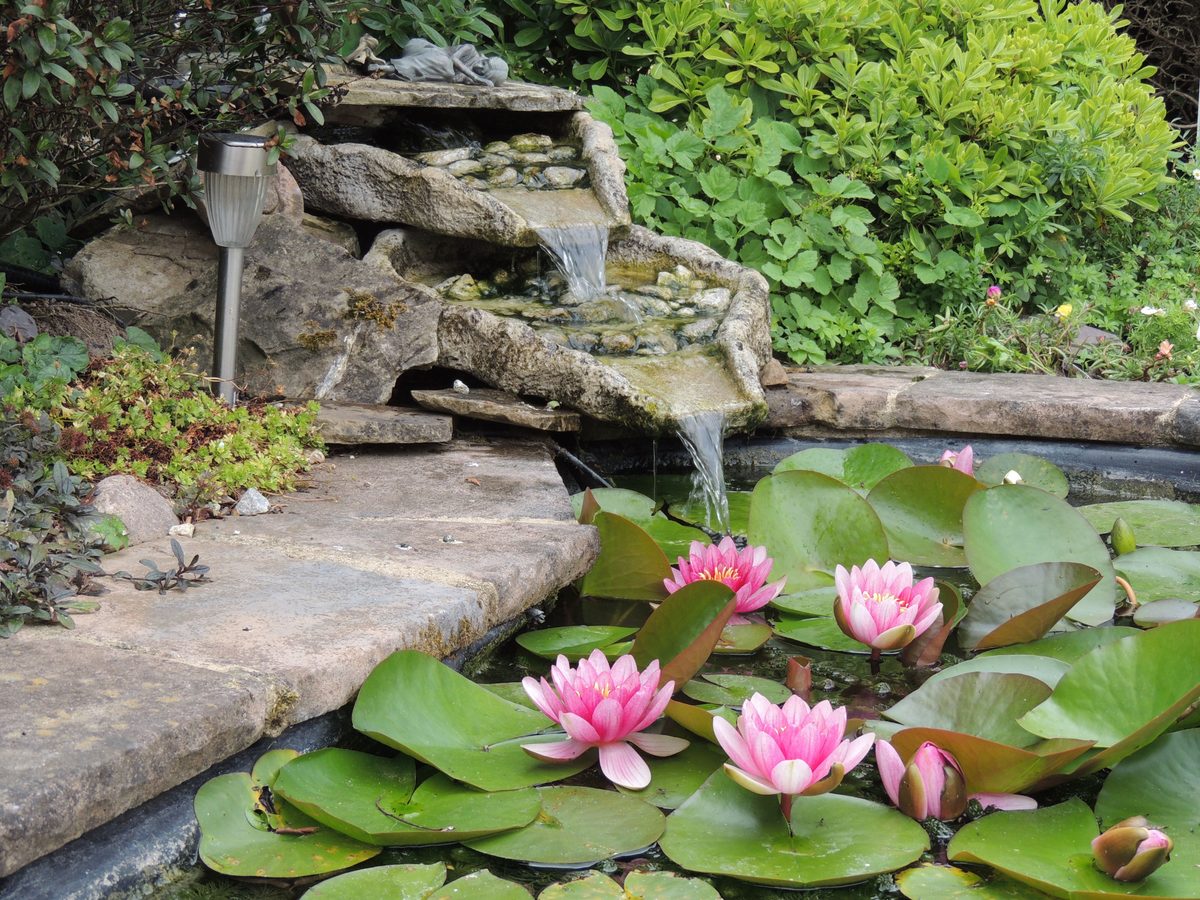
Abundant sunlight accelerates algae growth, requiring aggressive vegetation control through consistent algaecide application and monthly water changes. Adding beneficial bacteria treatments breaks down organic debris and supports clearer water between scheduled cleanings. High evaporation rates cause pumps to run dry and burn out without frequent water level monitoring. Hard water creates calcium and scale buildup on fountain surfaces and internal components, necessitating regular cleaning. Safe algaecides prevent green water while protecting aquatic plants and wildlife in multi-feature landscapes.
Which Protection Methods Are Most Effective in Temperate Regions?
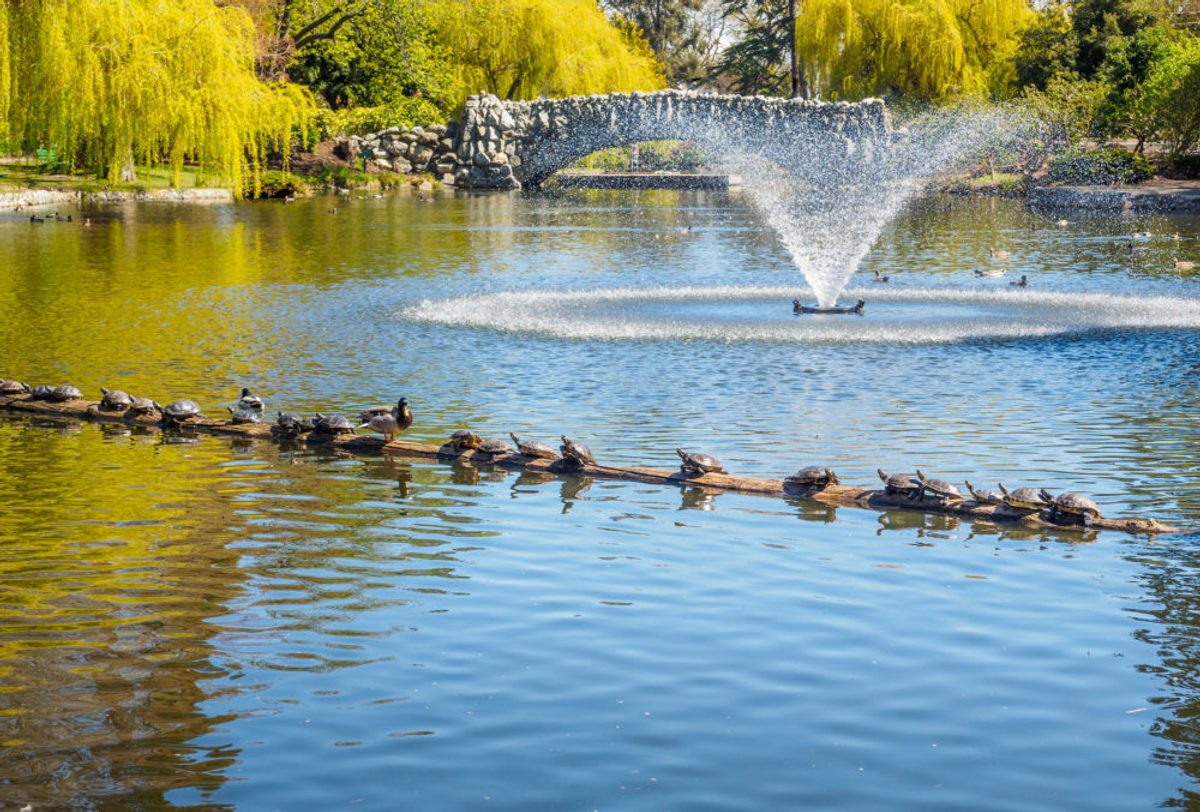
Environmental assessment determines whether climate conditions require strict winterization or allow year-round fountain operation. Temperate regions like Orange County benefit from continuous operation strategies that prevent stagnant water and mosquito breeding. Partial covers reduce evaporation and debris accumulation without requiring a complete fountain shutdown during mild winters. Choosing durable materials becomes more important than winterization protocols in consistently mild climates.
How Should You Plan Your Annual Fountain Maintenance Budget?
Comprehensive fountain maintenance budgeting accounts for electricity, water treatments, supplies, and occasional professional services. Annual costs vary based on fountain size, material quality, and local water conditions affecting treatment needs. Most residential fountains require $200 to $600 annually for complete upkeep, including all recurring expenses. Understanding these categories helps homeowners allocate resources effectively and avoid budget surprises during ownership.
What Are the Typical Annual Cost Categories for Fountain Upkeep?
Electricity costs $50 to $150 annually based on pump wattage and daily operation hours. Water treatments, including algaecides, clarifiers, and scale removers, add $100 to $200 yearly for standard maintenance. Maintenance supplies like brushes, filters, and minor repair components cost $50 to $100 per year. Pump replacement every 3-7 years adds $200 to $500 as a periodic major expense. Total residential fountain annual costs average $200 to $600 when all categories are combined.
How Can Professional Services Complement DIY Maintenance?
Professional services cost $200 to $600 for seasonal opening, closing, or major cleaning procedures. Orange County fountain service rates vary based on fountain complexity, accessibility, and service scope requirements. Professional pond maintenance offers expertise in diagnosing complex water quality issues and equipment malfunctions. Many homeowners adopt hybrid approaches, handling routine cleaning while outsourcing technical repairs and seasonal transitions.
What Are Expert Recommendations to Maximize Return on Investment?
Material selection should prioritize modern metals or sealed concrete for 20-year lifespans over short-lived resin. Comprehensive budgeting must include initial purchase, installation costs, infrastructure planning for plumbing and electrical lines, and annual maintenance across the expected ownership duration. Maintenance strategy decisions between DIY care and professional services affect both annual expenses and long-term value retention. Monthly pond maintenance costs provide benchmarks for evaluating professional service value against time investment.
What Factors Should Guide You in Choosing and Maintaining a Fountain?
Fountain selection requires balancing aesthetic preferences against practical maintenance realities and budget constraints. Environmental conditions, including climate, water quality, and sun exposure, determine care strategy effectiveness and maintenance frequency. Material durability, design complexity, and installation location create distinct maintenance profiles requiring different skill levels. Comprehensive planning ensures fountain enjoyment without financial strain or unexpected care burdens.
How Do Environmental Conditions Affect Maintenance Strategies?
Mediterranean climates feature mild winters and nearly 300 sunny days annually, eliminating most winterization requirements. Abundant sunshine accelerates algae growth, requiring more aggressive treatment protocols than cloudy temperate regions. Hard water conditions, common in many areas, cause mineral buildup requiring frequent acidic cleaning treatments. Environmental assessment informs realistic maintenance expectations and appropriate care protocol selection for specific conditions.
What Material and Design Considerations Influence Longevity and Costs?
Metal fountains offer 20-plus-year lifespans but command higher initial purchase prices than alternative materials. Concrete requires proper sealing every few years to prevent water penetration and structural degradation. Resin and composite materials reduce upfront costs but require replacement within 3-7 years of installation. Design complexity affects cleaning difficulty, with intricate architectural features requiring more maintenance time than simple tiered basins.
How Does Budget Planning Affect Ownership Satisfaction?
Realistic budgeting prevents financial stress by anticipating recurring expenses beyond the initial purchase price. Understanding total ownership costs allows informed decisions about fountain type, material quality, and maintenance strategy. Homeowners who plan comprehensively report higher satisfaction levels than those surprised by ongoing obligations. Pond fountain maintenance planning creates sustainable enjoyment by aligning expectations with financial and time resources.
Which Maintenance Approaches Optimize Fountain Longevity and Value?
Maintenance strategy selection balances DIY capabilities against professional expertise requirements for optimal fountain performance. Routine care, including water level monitoring, algae treatment, and debris removal, prevents major problems requiring expensive repairs. Professional services address complex issues like pump diagnostics, leak detection, and water chemistry imbalances beyond typical homeowner skills. Hybrid approaches combining owner-performed routine care with professional technical support often deliver the most cost-effective results.
Strategic maintenance preserves fountain function and aesthetic appeal while protecting property value investment returns. Regular cleaning prevents mineral deposits and algae buildup that accelerate material degradation and reduce lifespan. Timely pump replacement before complete failure prevents secondary damage to electrical systems and basin structures. Preventive care costs significantly less than reactive repairs, addressing neglect-related damage and component failures.
Annual Fountain Maintenance Budget: Integrating Costs, Care, and Investment Planning
The global outdoor fountain market, valued at $1.47 billion in 2026, projects growth to $2.03 billion by 2035. North America holds 35% market share, reflecting strong regional demand for residential and commercial installations. Fountains account for 64% of projected water feature demand gains through 2025, surpassing ponds as preferred products. Market expansion at 4.14% CAGR demonstrates sustained consumer interest in outdoor water features across demographic segments.
Successful fountain ownership requires integrating purchase decisions, maintenance planning, and long-term budget allocation into comprehensive strategies. Material selection, climate considerations, and maintenance approach choices directly influence total ownership costs and value retention. Homeowners who plan thoroughly enjoy water features that enhance property aesthetics while delivering strong financial returns. Strategic planning transforms fountains from maintenance burdens into sustainable investments supporting outdoor living quality.
Orange County Pond Services brings 25 years of expertise in helping homeowners optimize fountain performance and value retention. Their repair-first approach has saved customers thousands by diagnosing problems that others recommend replacing unnecessarily. Understanding fountain maintenance budgeting empowers informed decisions that balance enjoyment against realistic care obligations and costs.
Plan Your Fountain Budget with Orange County Pond Services
Orange County Pond Services helps homeowners across Orange County turn a maintenance budget into lasting fountain enjoyment. Our specialists handle cleaning, water quality protection, pump and water system repairs, and seasonal care, so your water feature stays beautiful without the guesswork. With over 25 years of hands-on experience and a repair-first approach, we have saved customers thousands by fixing problems other companies wanted to replace. Call us at 949-653-2305 or request your free quote to build a care plan that fits your fountain and your budget.

 Choosing the correct fountain size creates visual harmony in outdoor spaces while avoiding common design mistakes. Homeowners frequently select fountains based solely on height, ignoring basin width and viewing distance, which often produces unbalanced results.
 Leaving a fountain uncovered year-round in Orange County is generally feasible due to the region’s mild climate. The Mediterranean weather pattern creates conditions where traditional fountain winterization becomes unnecessary, though specific maintenance requirements remain critical. Understanding Orange County’s weather impact on fountains helps homeowners make informed decisions about protection strategies and care schedules.
 Pond and fountain owners face difficult decisions when equipment fails or water quality deteriorates. Understanding how to evaluate pond repair quotes helps you avoid unnecessary replacement costs and choose providers who solve root problems. The fountain and pond repair market generates strong demand, with fountain repair accounting for 35.4% of tracked search interest. Annual pond maintenance costs average $2,000, ranging from $450 to $5,000 depending on complexity.
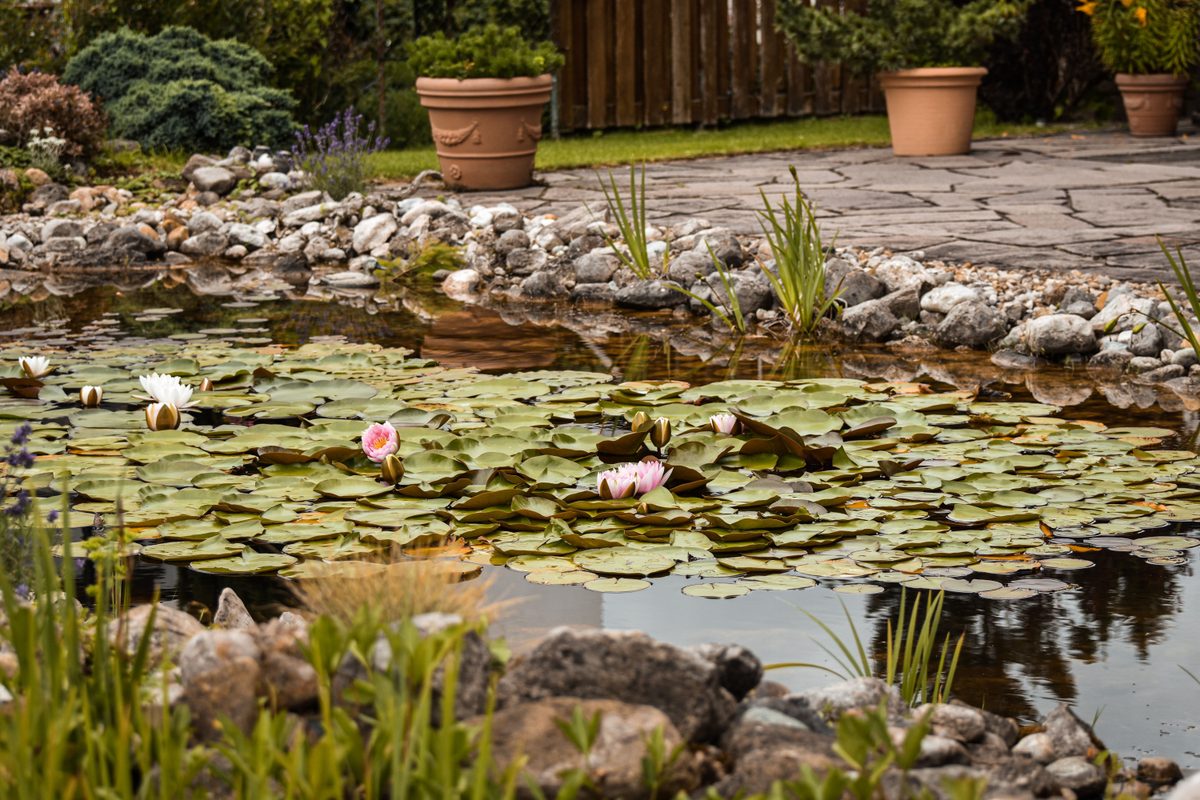 Homeowners in Orange County face distinct challenges when maintaining decorative ponds and water features. The region’s climate produces rapid summer evaporation, while high property values and established landscaping make water features significant investments requiring specialized care.
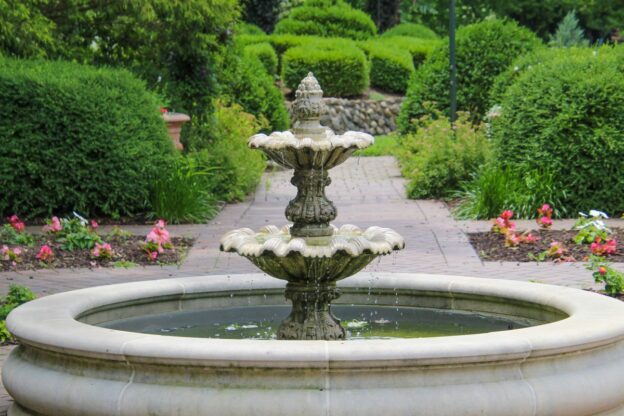
 The moment you decide to buy a fountain carries both excitement and risk. What begins as a vision of tranquil water sounds can become a costly regret when key questions go unanswered. In Orange County, where the median home value reaches $962,600 and 56% of residents own their homes, fountain decisions carry weight. With a median household income of $116,289, buyers have the means to invest but also the expectation of quality returns.
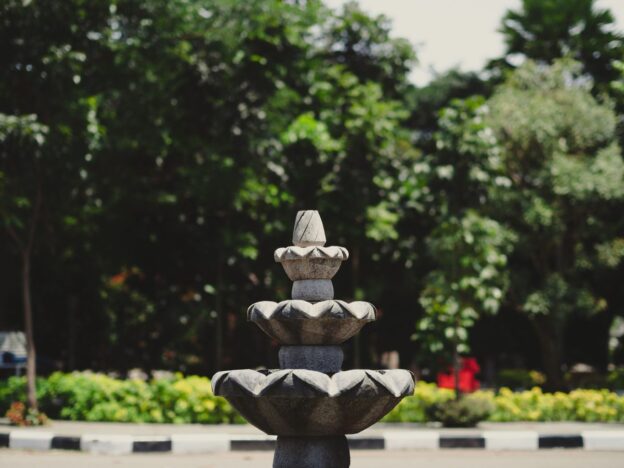
 Selecting a fountain repair company involves comparing technical capability, pricing structure, and long-term service value. Homeowners often face urgent decisions when pumps fail, leaks appear, or water quality deteriorates rapidly. Effective evaluation requires understanding which services address root causes versus temporary cosmetic fixes and how pricing tiers reflect scope differences rather than simple cost variations.
 Most fountain buyers lead with aesthetics and regret it later. Orange County’s median home value of $962,600, homeownership rate of 56.4%, and median household income of $116,289 create a market where wrong choices are expensive.
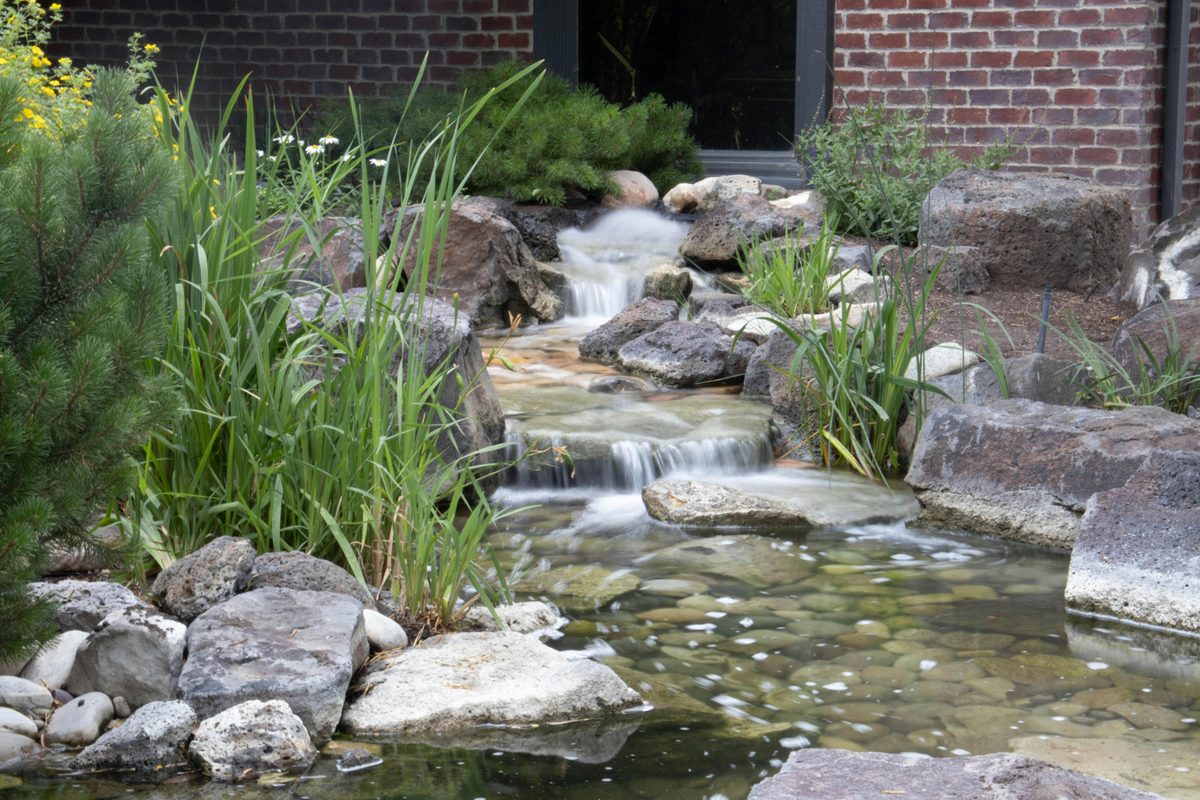
 A rock garden fountain transforms outdoor spaces by combining water movement with natural stone textures and surrounding vegetation. The global outdoor water fountain market reached $3.8 billion in 2025 and is forecast to grow to $6.4 billion by 2034, with freestanding fountains holding 34.2% of the market. In the U.S., residential demand accounts for 84% of landscaping water features, and fountains are responsible for 64% of demand gains through 2025.
 Key Takeaways: