Key Takeaways:
- All submersible pumps require minimum 4-6 inches water coverage preventing cavitation damage—low water levels cause loud grinding noise and immediate pump failure risk.
- Wall fountains need 6-10 inches (mild climate) or 8-14 inches (cold/windy), bowl fountains 10-12 or 12-16, tiered fountains 12-16 or 16-24 (lowest basin), pondless 18-24 or 24-36 inches.
- Basin depth calculation: pump height + 4-6″ submersion + 2-4″ evaporation buffer + 2-4″ splash allowance determines minimum total depth for reliable operation.
- Wind exposure increases depth requirements 25-50% while hot dry conditions accelerate evaporation demanding deeper basins as buffers preventing daily refilling.
- Shallow basins (under 10 inches) breed algae and mosquitoes faster, require daily refilling, and increase pump failure risk—proper depth dramatically reduces maintenance burden.
Fountain depth determines pump performance, water quality, and maintenance frequency. The basin must accommodate pump submersion, evaporation losses, and splash containment. Incorrect depth causes pump failure and excessive refilling.
This guide explains depth requirements by fountain type and climate. You’ll learn the 4-6 inch minimum submersion rule and depth ranges from 6 to 36 inches.
What is the recommended depth for an outdoor fountain?
How is outdoor fountain depth typically defined?
Fountain depth refers to total basin capacity from bottom to operating water level. This impacts pump performance, water quality, and maintenance. Properly sized basins account for pump submersion, evaporation buffer, splash containment, and freeze protection.
Depth recommendations vary by fountain style and climate. Wall fountains need 6-14 inches, bowl fountains require 10-16 inches, tiered fountains demand 12-24 inches, and pondless systems need 18-36 inches.
Why is depth measured differently from visible water level?
Depth encompasses total basin capacity, not just visible water surface. Measurement includes pump submersion requirements, evaporation buffer, and splash-out protection margin. Total depth combines operational water plus safety margins.
Operating level represents normal water height during operation. Additional depth below provides pump clearance while depth above allows for evaporation and splash losses. This buffer prevents daily refilling.
How does depth relate to water volume capacity?
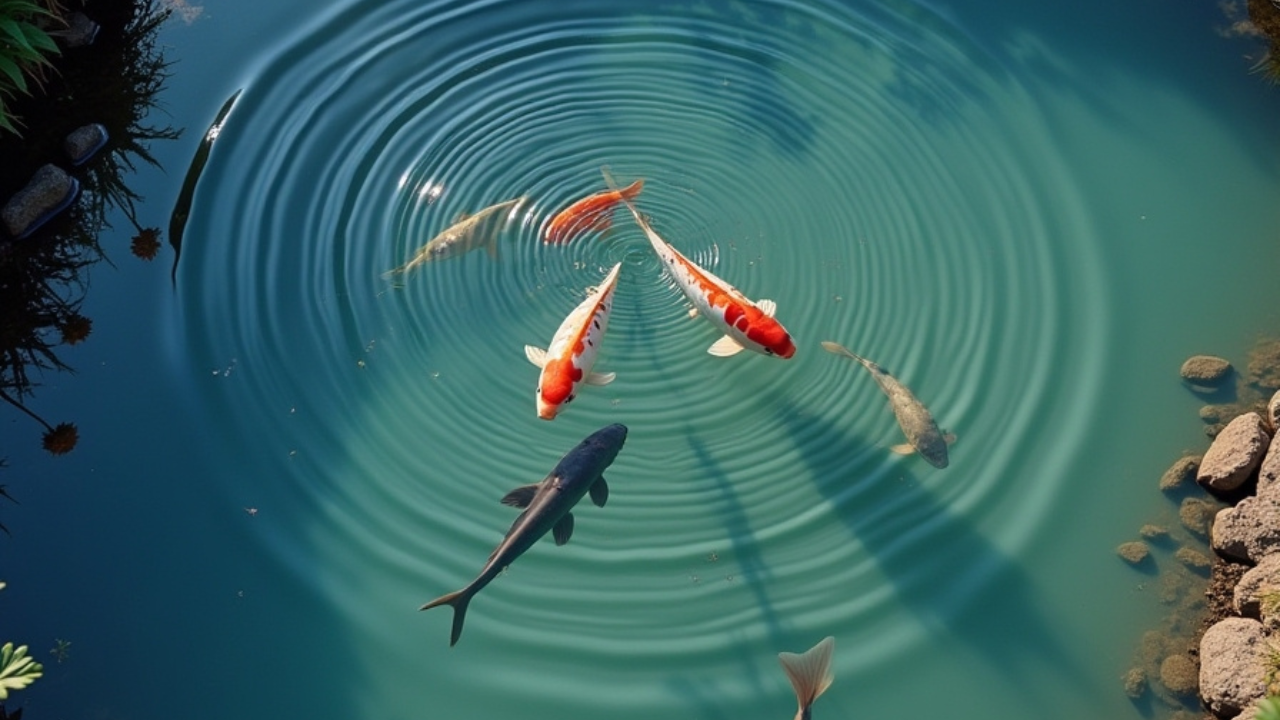
Deeper basins provide larger volume reducing daily refill frequency. Water volume affects thermal mass for freeze protection. Sufficient volume maintains pump submersion during normal water loss.
Larger volume dilutes debris concentration. Doubling depth more than doubles usable volume depending on basin shape. This volume buffer separates reliable fountains from high-maintenance installations.
Why does outdoor fountain depth matter?
How does fountain depth affect pump submersion and cooling?
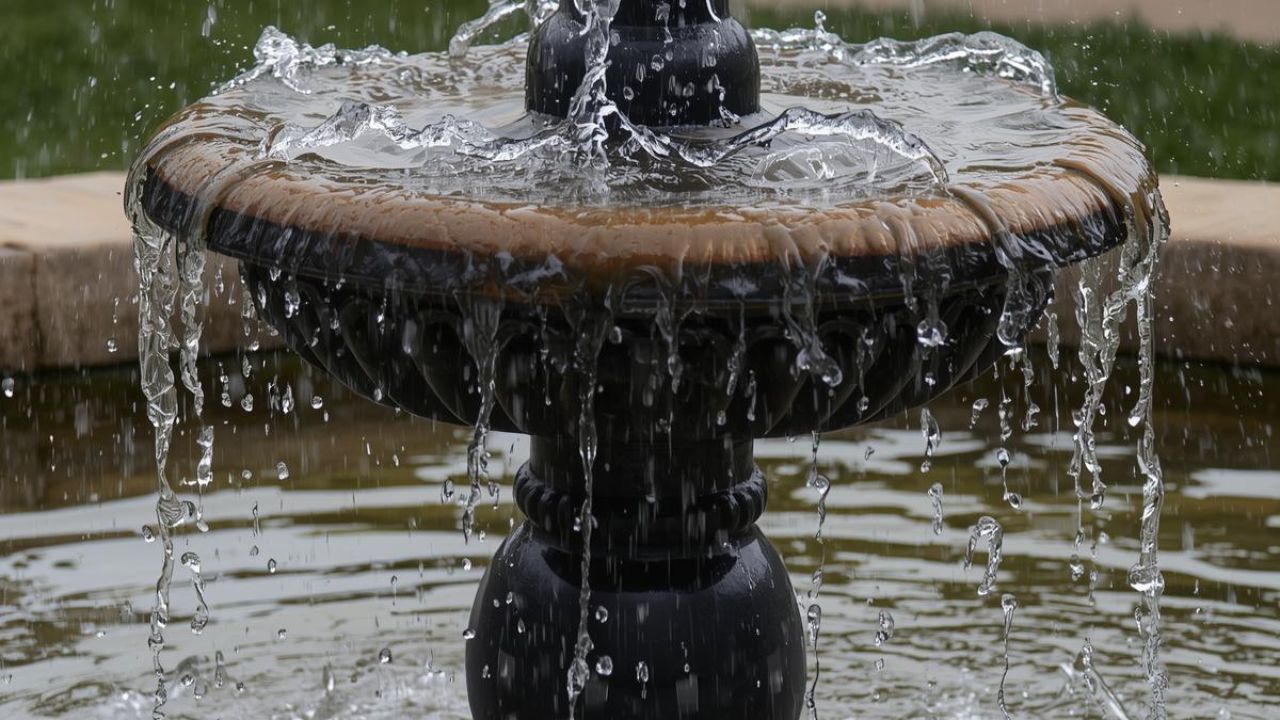
All submersible pumps must remain fully underwater to stay cool and prevent cavitation damage. Most pumps require a minimum 4-6 inches of water coverage. Insufficient depth leads to pump failure.
Cavitation occurs when low water exposes the pump intake creating loud grinding noise. Turn off the pump immediately and add water until fully submerged by 4-6 inches. Repeated cavitation destroys pump motors.
Why does proper depth prevent water loss issues?
Water evaporates especially in hot, dry, or windy conditions. Deeper basins provide larger volumes acting as evaporation buffers preventing daily refilling. Basin depth combined with width contains splash, minimizing water loss.
Shallow basins reach critical low levels faster. Adequate depth maintains operational levels between maintenance visits. This buffer proves essential in climates with high evaporation or wind exposure.
How does depth impact fountain stability and performance?
Deeper bowls prove more stable and less prone to evaporation. Sufficient depth ensures consistent pump performance. Basin water depth influences sound profile—water falling onto river stone produces softer sounds than falling into deep pools.
The basin acts as both water supply and splash containment. Insufficient depth creates operational instability requiring constant monitoring.
How deep should common outdoor fountain types be?
How deep should freestanding basin fountains be?
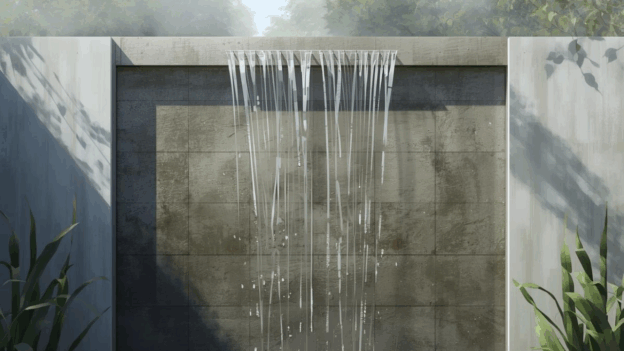
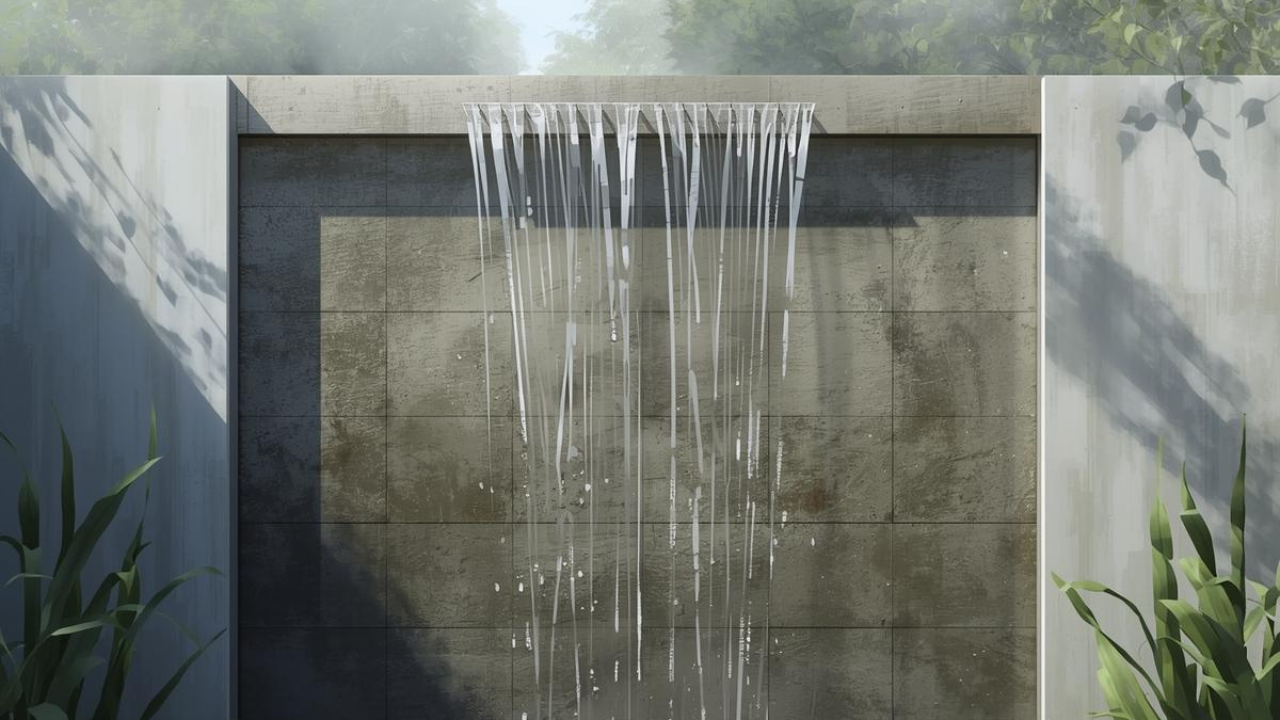
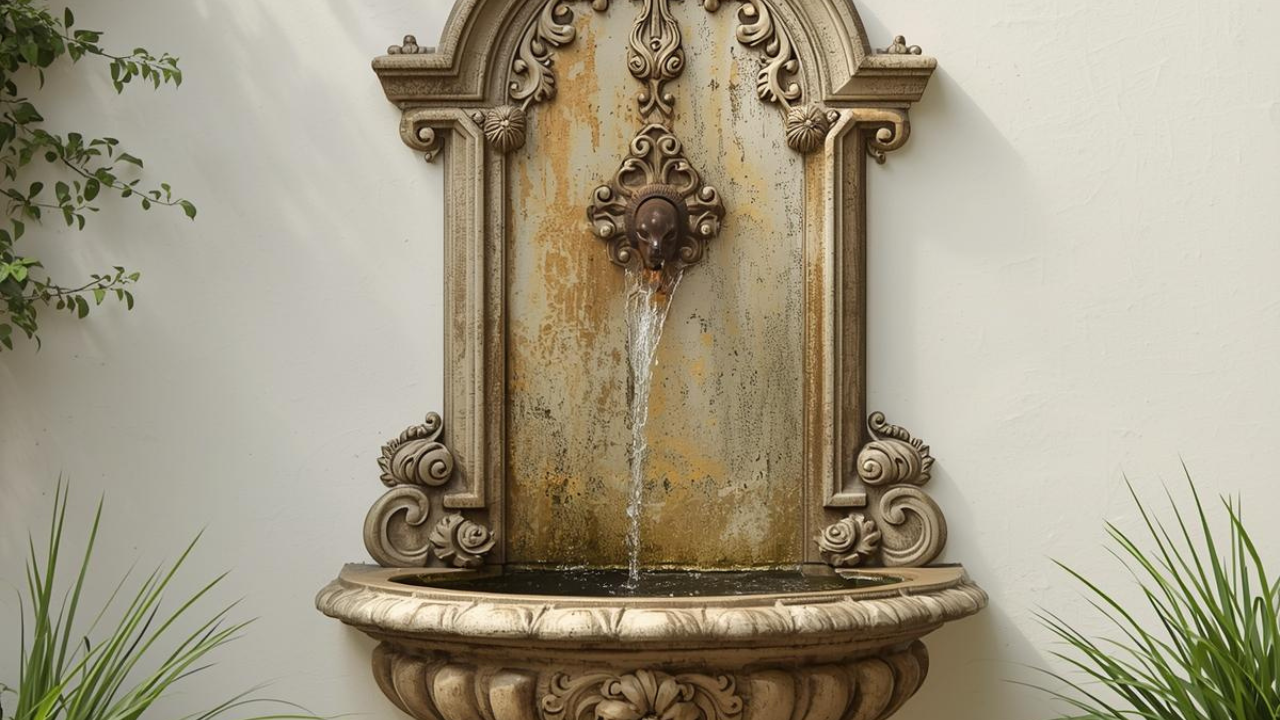
Wall fountains (small) need 6-10 inches in mild climates and 8-14 inches in cold or windy conditions. Bowl fountains require 10-12 inches for mild climates and 12-16 inches for harsh conditions. Deeper bowls deliver greater stability.
One small patio installation used a 10-inch deep, 30-inch wide basin for a 12-inch copper scupper spout. The sheltered location allowed shallower depth while maintaining pump submersion and splash containment.
How deep should tiered outdoor fountains be?
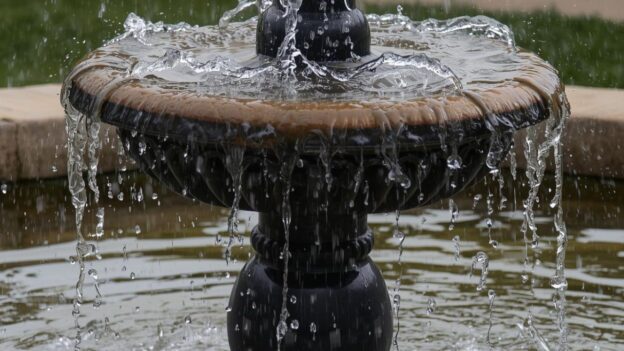
Tiered fountains need 12-16 inches (lowest basin) in mild climates and 16-24 inches in cold or windy conditions. The main reservoir must support the entire system’s water volume as all tiers drain into the lowest basin.
Inadequate depth causes the system to run dry as water distributes across multiple levels. The bottom reservoir depth determines overall system capacity and reliability.
How deep should reservoir-based or pondless fountains be?
Pondless fountains require 18-24 inches in mild climates and 24-36 inches in cold or windy conditions. This depth stores enough water to run features without frequent refills.
One cold-climate installation buried a pondless reservoir 30 inches below ground beneath the frost line. Heavy-duty 316 stainless steel construction with sloped plumbing allowed complete drainage during winterization.
How does fountain size influence ideal depth?
How does fountain diameter affect minimum depth?
Basin width must be at least twice the water fall’s drop height for splash control. Width and depth work together for stability. Floor bowl fountains need 10-12 inches in mild climates and 12-16 inches in harsh conditions.
Wider basins with shallow depth become unstable and lose excessive water to splash. Proper proportions maintain structural integrity and operational reliability.
Why do larger fountains require deeper basins?
Main reservoirs must support entire system water volumes. Larger features have higher total water volume requirements. Greater water volume prevents proportional water loss from having outsized impact.
Deeper basins provide stability for larger structures and absorb splash without overflow. The increased volume maintains water quality longer. Proper outdoor fountain installation accounts for volume-to-size relationships.
How does water volume help manage splash and overflow?
Deeper basins provide larger volumes absorbing splash without overflow. Even well-designed fountains experience splash-out events. Depth combined with width creates containment capacity preventing rapid water level drops. Larger volume buffers temporary splash events from wind gusts or flow surges.
Basin depth prevents overflow during splash while maintaining minimum pump submersion. The volume acts as a shock absorber for operational variations. Inadequate depth causes splash to immediately deplete water below safe operating levels requiring emergency refills.
How does water flow rate affect how deep a fountain should be?
How does splash height increase depth requirements?
Higher drops create more sound but also more splash. Mounting height of 12-18 inches proves common for pleasant sound without excessive overspray. Greater drop height demands deeper basins for splash containment. Basin width must be at least twice the water fall’s drop height while depth provides vertical splash containment.
Higher flow rates combined with greater drops create more splash volume. The basin must contain this splash while maintaining pump submersion. Shallow basins with high-flow installations quickly lose water to splash and evaporation requiring constant refilling.
Why does higher flow demand greater water reserve?
Higher flow rates circulate more water volume requiring larger total water volume. The 10 GPM per linear foot of spout width formula determines flow requirements. Higher GPM demands proportionally deeper reservoirs preventing rapid water level fluctuation. Adequate depth maintains pump submersion during high-flow operation.
Greater circulation volume needs sufficient reserve preventing system depletion. The pump continuously moves water from basin to spout—inadequate basin depth causes level to drop below pump intake. Choosing the right fountain pump ensures flow rate matches basin capacity.
How does return-water speed influence basin depth?
Water falling directly into deep pools produces different sounds than falling onto river stone beds. Return water speed affects splash patterns—faster return requires deeper basins containing turbulence. Basin water depth influences sound profile and splash characteristics significantly.
Deeper water absorbs return flow energy reducing splash. The falling water’s kinetic energy dissipates in deep basins rather than creating a splash. Shallow basins cause return water to splash violently increasing water loss and noise levels beyond design intentions.
How do environmental conditions affect outdoor fountain depth?
How does wind exposure increase minimum depth needs?
Windy locations require deeper basins compensating for wind-driven splash. One windy deck installation used an 18-inch deep, 48-inch wide basin containing splash from prevailing winds. The extra depth proved essential combined with a narrow 6-inch brass nozzle and copper mesh splash guard.
Depth adjustments for wind exposure show clear patterns: wall fountains increase from 6-10 inches to 8-14 inches, bowl fountains from 10-12 to 12-16 inches, tiered fountains from 12-16 to 16-24 inches, and pondless fountains from 18-24 to 24-36 inches. Wind demands 25-50% depth increases.
How does sun exposure change evaporation rates?
Water evaporates especially in hot, dry, or windy conditions. Deeper basins provide evaporation buffers preventing daily refilling. Sun exposure accelerates evaporation rates significantly. Larger water volume reduces evaporation impact as percentage of total capacity.
Shallow basins in full sun lose water rapidly requiring multiple daily refills. Deep basins maintain operational levels longer between maintenance visits. The thermal mass of larger volumes also moderates temperature fluctuations affecting water quality and evaporation rates.
How do surrounding hard surfaces affect splash-back?
Overspray causes water loss and damages surrounding surfaces. Hard surfaces near fountains increase splash-back concerns requiring deeper basins with adequate width. Splash control demands both horizontal and vertical containment—basin width captures initial splash while depth contains splash-back.
Deeper basins combined with wider dimensions prevent splash from escaping and damaging surrounding hardscape. The containment volume must accommodate both primary splash from falling water and secondary splash-back from nearby surfaces. Inadequate depth allows compound splash losses.
How do climate and seasonal conditions influence fountain depth?
How does hot weather impact minimum operating depth?
Hot, dry conditions accelerate evaporation dramatically. Deeper basins act as evaporation buffers preventing daily refilling requirements. Larger water volume maintains levels during extended hot periods without constant intervention. Shallow, warm water breeds algae and mosquitoes faster than deep, cooler water.
High temperatures increase water loss through both evaporation and increased splash from thermal expansion effects. Adequate depth provides thermal stability maintaining cooler water temperatures. This depth buffer separates low-maintenance installations from constant-care fountains during summer months.
How does freezing weather affect basin depth requirements?
Deeper basins provide larger thermal mass offering protection against hard freezes. Additional depth provides space for water expansion as it turns to ice preventing basin structure damage. Severe winters require fountain drainage and winterization regardless of depth.
Cold climate depth increases prove substantial: wall fountains need 8-14 inches versus 6-10 inches mild, bowl fountains 12-16 versus 10-12, tiered fountains 16-24 versus 12-16, and pondless 24-36 versus 18-24 inches. One installation buried a pondless reservoir 30 inches below ground beneath the frost line with sloped plumbing for complete drainage.
Why does seasonal water level fluctuation matter?
Evaporation rates vary by season creating water level fluctuations. Hot dry seasons increase water loss while cold seasons may require drainage. Seasonal variation demands depth buffers accommodating changes without constant adjustment. Adequate depth prevents pump exposure during seasonal water level shifts.
The buffer between minimum pump submersion and maximum operating level must accommodate worst-case seasonal conditions. Summer evaporation and winter freeze-thaw cycles stress fountain systems. Proper depth planning accounts for annual variation rather than optimal-condition performance.
What pump and plumbing factors determine required fountain depth?
How does pump intake clearance affect minimum depth?
All submersible pumps require full underwater submersion with minimum 4-6 inches water coverage. This prevents cavitation damage from running dry. The pump must stay cool through water submersion at all times. Low water levels cause cavitation with loud grinding noise indicating imminent pump failure.
Basin depth must exceed pump height plus 4-6 inch coverage plus evaporation buffer. Additional depth for the splash loss buffer adds 2-4 inches minimum. Total minimum depth calculation: pump height + 4-6″ submersion + 2-4″ evaporation buffer + 2-4″ splash allowance. Quality fountain pumps specify submersion requirements.
How does pump flow capacity relate to water depth?
Pump flow capacity of 10 GPM per linear foot of spout width determines circulation demands. Higher flow capacity requires larger water volume reserves. Adequate depth maintains pump submersion during high-flow operation preventing dry-running scenarios. Basin depth must support the pump’s total water circulation needs.
Insufficient depth causes pumps to run dry during operation as water circulates to elevated features. The basin volume must accommodate water temporarily removed from the reservoir during circulation. Proper depth ensures adequate volume remains for continuous pump submersion regardless of circulation demands.
Why does plumbing layout affect usable depth?
Pump placement within basins affects usable depth. Plumbing connections require clearance space reducing effective depth. Intake and outlet positioning affects water circulation patterns and effective volume utilization. Proper layout prevents air lock issues requiring adequate submersion.
Sloped plumbing for drainage requires basin depth consideration for winterization. All plumbing must allow complete drainage preventing freeze damage. The depth must accommodate both operational requirements and seasonal drainage needs. Layout planning affects how much specified depth actually supports pump operation.
How does fountain depth affect maintenance requirements?
Why do shallow fountains need more frequent refilling?
Shallow basins have smaller water volumes depleted faster through evaporation and splash. Smaller volume means water loss represents a larger percentage of total capacity. This requires daily refilling in hot, dry, or windy conditions. Deeper basins act as buffers extending time between refills.
One installation with 10-inch depth in a sheltered patio needed weekly refills. Another with 18-inch depth in a windy location needed a similar frequency despite harsher conditions. The deeper volume compensated for increased environmental losses. Regular fountain maintenance depends heavily on adequate depth.
How does deeper water dilute debris buildup?
Larger water volume dilutes debris concentration maintaining water quality longer. Deeper basins reduce impact of organic matter accumulation. More volume means debris represents a smaller percentage of total water. This supports better circulation patterns and reduces cleaning frequency.
Debris accumulation proves less noticeable in larger volumes. Deeper water maintains clarity longer between cleanings. The dilution effect of greater depth separates low-maintenance fountains from constant-care installations requiring weekly cleaning.
How does depth influence algae growth patterns?
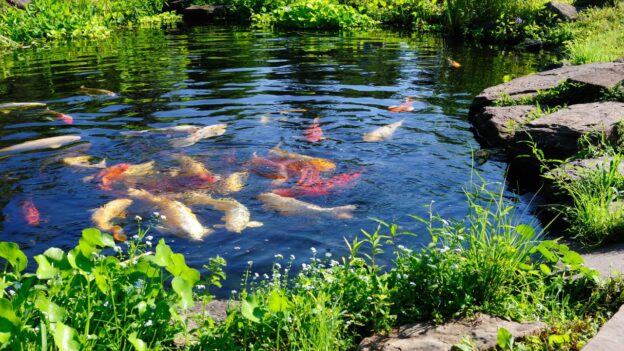
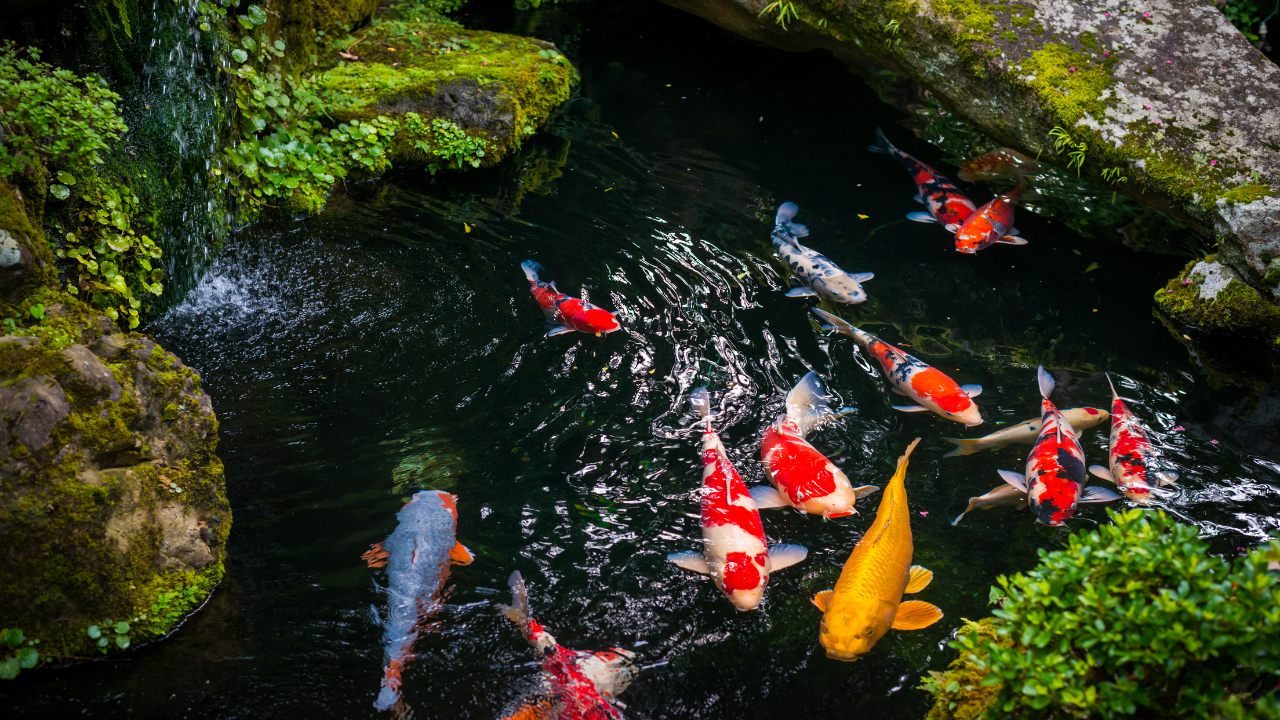
Shallow, warm water breeds algae and mosquitoes rapidly. Deeper, cooler water helps mitigate these issues combined with proper circulation and treatment. Shallow bowls prove more prone to evaporation creating warm stagnant conditions. Deeper water remains cooler reducing algae growth rates.
Larger volume supports better treatment effectiveness—chemicals and biological controls work better in stable deeper water. Temperature fluctuations prove greater in shallow water stressing water quality. Adequate depth provides thermal stability discouraging rapid algae proliferation.
What problems occur if an outdoor fountain is too shallow?
Why do pumps run dry more easily?
Shallow basins reach critical low levels faster through combined evaporation and splash. Cavitation risks increase dramatically—low water exposes pump intakes causing loud grinding and immediate damage risk. Turn off the pump immediately when cavitation occurs and restore water level to 4-6 inches above the pump.
Running dry damages pump motors through overheating. Cavitation destroys pump components requiring replacement. Shallow basins increase pump failure risk substantially. Even brief dry-running episodes reduce pump lifespan. The depth buffer between operating level and pump exposure proves critical for equipment longevity.
How does shallow depth increase splash loss?
Shallow basins lack volume containing splash effectively. Even well-designed fountains experience splash-out—shallow depth cannot absorb these events. Basin depth must contain the majority of splashing, preventing excessive water loss. Overspray becomes a chronic issue with shallow basins.
Splash loss leads to rapid water level drops exposing pumps. The cycle of splash loss causing low water requiring emergency refills creates a maintenance burden. Shallow depth combined with inadequate width magnifies splash problems exponentially. Environmental factors like wind compound shallow basin vulnerabilities.
Why does shallow water lead to higher maintenance?
Shallow warm water breeds algae and mosquitoes requiring frequent treatment. Smaller volume means more concentrated debris requiring frequent cleaning. Water quality degrades faster in shallow basins. Temperature fluctuations prove greater affecting water chemistry.
Higher maintenance includes potentially daily refilling, weekly cleaning, and constant water treatment. The cumulative time and cost burden makes shallow fountains impractical. Proper depth dramatically reduces maintenance frequency and intensity creating enjoyable rather than burdensome installations.
What problems occur if an outdoor fountain is too deep?
How does excessive depth increase installation complexity?
Deeper excavation requires more labor and potentially professional installation. Heavier basin materials needed for deeper construction increase shipping and handling costs. Structural support requirements increase with depth. Installation difficulty escalates with depth beyond optimal specifications.
Achieving proper depth in existing structures proves more difficult with excessive requirements. The complexity translates directly to higher installation costs without performance benefits. Depth beyond functional requirements creates unnecessary expense and effort during the construction phase.
Why can deeper basins make maintenance harder?
Pump access becomes more difficult in very deep basins requiring reaching deeper to service equipment. Cleaning basin bottoms requires more effort and may need specialized tools. Debris removal from deep basins proves more challenging than shallow maintenance.
Winter drainage becomes more complex with excessive depth. The additional volume takes longer to drain and may complicate winterization procedures. While deep basins reduce refilling frequency, they create other maintenance challenges when service becomes necessary. Balance proves essential.
How does unnecessary depth increase project cost?
More basin material required for extra depth increases material costs. Larger water volume means higher initial fill costs. Greater excavation demands higher labor expenses. Shipping costs increase for deeper and heavier basins without performance benefits.
Diminishing returns on maintenance benefits mean depth beyond optimal provides minimal advantage. No performance improvement occurs beyond properly specified depth. The unnecessary expense cannot be justified by operational benefits. Optimal depth balances cost against performance rather than maximizing depth.
What should be considered before finalizing outdoor fountain depth?
How do fountain type, flow rate, and environment align?
Wall fountains need 6-10 inches of mild climate or 8-14 inches of cold/windy conditions. Bowl fountains require 10-12 inches mild or 12-16 inches harsh. Tiered fountains demand 12-16 inches mild (lowest basin) or 16-24 inches cold/windy. Pondless systems need 18-24 inches mild or 24-36 inches cold/windy.
Flow rate affects depth through circulation volume—higher flow (10+ GPM per foot spout width) requires deeper reservoirs. Environmental factors modify baseline depths: wind exposure increases depth 25-50%, hot/dry climates add evaporation buffer, cold climates add freeze protection. Universal minimum: 4-6 inches pump submersion regardless of type.
When is professional depth sizing recommended?
Large tiered fountains with complex water volume requirements benefit from professional calculation. Cold climate installations requiring frost line burial (30 inches) need expert design. Custom pondless systems with hidden reservoirs demand professional sizing. High-flow installations exceeding standard guidelines require specialized knowledge.
Professional consultation ensures accurate water volume calculations, proper pump submersion specifications, and climate-appropriate depth recommendations. Code compliance for frost line requirements and drainage system design for winterization require expertise. Severe climate conditions need specialized design preventing expensive mistakes.
What is the next step in determining proper outdoor fountain depth?
Identify fountain type selecting from wall, bowl, tiered, or pondless with corresponding depth ranges. Assess climate determination if location proves mild or cold/windy, then adjust depth accordingly. Calculate flow requirements based on spout width using the 10 GPM per foot formula and ensure depth supports circulation volume.
Evaluate environmental factors measuring wind exposure, sun exposure, and surrounding surfaces. Verify pump requirements confirming 4-6 inch minimum submersion plus evaporation buffer (2-4 inches) and splash allowance (2-4 inches). Plan for maintenance considering access requirements and refill frequency tolerance. Use a depth table as a starting point, adjust for specific site conditions, and consult professionals for complex installations.
Determine Your Optimal Fountain Depth With Professional Guidance
Fountain depth determines reliability, maintenance frequency, and equipment longevity. The 4-6 inch minimum pump submersion, climate-specific depth ranges, and environmental adjustments provide baseline specifications. However, improper depth calculations cause pump failure, excessive water loss, and constant maintenance demands.
Orange County Pond Services specializes in fountain design with proper depth specifications for local climate conditions. Our team calculates water volumes, pump submersion requirements, and environmental adjustments ensuring reliable operation. We prevent common depth errors through accurate sizing and professional installation. Contact us for expert consultation and discover the optimal depth configuration delivering low-maintenance performance your fountain deserves.